Logarithmic Regression AlternativeLogarithmic regression is typically used to model situations where growth or decay accelerates rapidly at first and then slows over time. Bitcoin is a good example.
𝑦 = 𝑎 + 𝑏 * ln(𝑥)
With this logarithmic regression (log reg) formula 𝑦 (price) is calculated with constants 𝑎 and 𝑏, where 𝑥 is the bar_index .
Instead of using the sum of log x/y values, together with the dot product of log x/y and the sum of the square of log x-values, to calculate a and b, I wanted to see if it was possible to calculate a and b differently.
In this script, the log reg is calculated with several different assumed a & b values, after which the log reg level is compared to each Swing. The log reg, where all swings on average are closest to the level, produces the final 𝑎 & 𝑏 values used to display the levels.
🔶 USAGE
The script shows the calculated logarithmic regression value from historical swings, provided there are enough swings, the price pattern fits the log reg model, and previous swings are close to the calculated Top/Bottom levels.
When the price approaches one of the calculated Top or Bottom levels, these levels could act as potential cycle Top or Bottom.
Since the logarithmic regression depends on swing values, each new value will change the calculation. A well-fitted model could not fit anymore in the future.
Swings are based on Weekly bars. A Top Swing, for example, with Swing setting 30, is the highest value in 60 weeks. Thirty bars at the left and right of the Swing will be lower than the Top Swing. This means that a confirmation is triggered 30 weeks after the Swing. The period will be automatically multiplied by 7 on the daily chart, where 30 becomes 210 bars.
Please note that the goal of this script is not to show swings rapidly; it is meant to show the potential next cycle's Top/Bottom levels.
🔹 Multiple Levels
The script includes the option to display 3 Top/Bottom levels, which uses different values for the swing calculations.
Top: 'high', 'maximum open/close' or 'close'
Bottom: 'low', 'minimum open/close' or 'close'
These levels can be adjusted up/down with a percentage.
Lastly, an "Average" is included for each set, which will only be visible when "AVG" is enabled, together with both Top and Bottom levels.
🔹 Notes
Users have to check the validity of swings; the above example only uses 1 Top Swing for its calculations, making the Top level unreliable.
Here, 1 of the Bottom Swings is pretty far from the bottom level, changing the swing settings can give a more reliable bottom level where all swings are close to that level.
Note the display was set at "Logarithmic", it can just as well be shown as "Regular"
In the example below, the price evolution does not fit the logarithmic regression model, where growth should accelerate rapidly at first and then slows over time.
Please note that this script can only be used on a daily timeframe or higher; using it at a lower timeframe will show a warning. Also, it doesn't work with bar-replay.
🔶 DETAILS
The code gathers data from historical swings. At the last bar, all swings are calculated with different a and b values. The a and b values which results in the smallest difference between all swings and Top/Bottom levels become the final a and b values.
The ranges of a and b are between -20.000 to +20.000, which means a and b will have the values -20.000, -19.999, -19.998, -19.997, -19.996, ... -> +20.000.
As you can imagine, the number of calculations is enormous. Therefore, the calculation is split into parts, first very roughly and then very fine.
The first calculations are done between -20 and +20 (-20, -19, -18, ...), resulting in, for example, 4.
The next set of calculations is performed only around the previous result, in this case between 3 (4-1) and 5 (4+1), resulting in, for example, 3.9. The next set goes even more in detail, for example, between 3.8 (3.9-0.1) and 4.0 (3.9 + 0.1), and so on.
1) -20 -> +20 , then loop with step 1 (result (example): 4 )
2) 4 - 1 -> 4 +1 , then loop with step 0.1 (result (example): 3.9 )
3) 3.9 - 0.1 -> 3.9 +0.1 , then loop with step 0.01 (result (example): 3.93 )
4) 3.93 - 0.01 -> 3.93 +0.01, then loop with step 0.001 (result (example): 3.928)
This ensures complicated calculations with less effort.
These calculations are done at the last bar, where the levels are displayed, which means you can see different results when a new swing is found.
Also, note that this indicator has been developed for a daily (or higher) timeframe chart.
🔶 SETTINGS
Three sets
High/Low
• color setting
• Swing Length settings for 'High' & 'Low'
• % adjustment for 'High' & 'Low'
• AVG: shows average (when both 'High' and 'Low' are enabled)
Max/Min (maximum open/close, minimum open/close)
• color setting
• Swing Length settings for 'Max' & 'Min'
• % adjustment for 'Max' & 'Min'
• AVG: shows average (when both 'Max' and 'Min' are enabled)
Close H/Close L (close Top/Bottom level)
• color setting
• Swing Length settings for 'Close H' & 'Close L'
• % adjustment for 'Close H' & 'Close L'
• AVG: shows average (when both 'Close H' and 'Close L' are enabled)
Show Dashboard, including Top/Bottom levels of the desired source and calculated a and b values.
Show Swings + Dot size
Search in scripts for "Up down"

Z-ScoresTLDR
Z-Scores ask "How many standard deviations is the current price, away from the moving average?"
Or put another way, it tells you how an asset is performing relative to its own moving average, centered about the zero-point.
INTRODUCTION
Z-Scores are a fundamental statistical concept which take any dataset (in this case price), and present the data in terms of standard deviation. In the case of price, we're using *moving* standard deviations, much like we use a moving average.
A useful aspect of z-scores is that data oscillates around a zero point. The chart then presents the "number_of_standard_deviations" that price is, away from the moving average. So for example, if we're looking at the 100-day z-score, and the price = 0, that means that the current price is right at the 100-day moving average. If price = 1, that means that the price is 1 standard deviation above the 100-day moving average.
HOW DO I USE THIS?
This particular script offers a ribbon of z-scores (much like how you might have a ribbon of moving averages). You can enter up to 5 z-scores in the options. Enter "0" to remove a ribbon from the chart.
If you're a math nerd, you can also select "Use Log Transform," which effectively uses the geometric mean for z-score calculation. For charts that are rangebound, you dont really need this option, but for charts that are highly exponential, you might want to select this.
I've noticed that z-scores tend to behave similar to RSI. I prefer z-scores because they're a non-arbitrary, fundamental statistical concept, whereas the RSI calculation is somewhat arbitrary. I offer the z-score as a ribbon, because it removes the arbitrary nature of selecting one particular moving average
PRACTICAL APPLICATION
Z-Score prices are akin to a momentum and/or trend indicator. They're useful for identifying a trending market, or trend reversals, before the actual price begins to reverse in earnest. The RSI concept of "divergence" can be applied. It can also be used to see how far out of trend a particularly violent movement up/down is, historically.
Another particularly useful aspect of z-scores, is comparing the performance of two different assets with very different price points. For example, maybe one chart is measured in cents, and another chart is measured in billions. Z-Scores normalize prices to a zero point, and normalize differing volatility by presenting it in terms of standard deviations. I use this for comparing things like in-asset-class performance, and also comparing various asset classes to others.
Remember, the z-score tells you how an asset is performing relative to its own moving average, centered about the zero-point.
CLOSING
I'm adding this to the public repository because there isnt a good z-score implementation here on TradingView, and especially not one that offers an adjustable ribbon like this. For the sharp eye, there is useful signal in z-scores, whether applied to a single asset, or to compare the performance of two assets against each other.

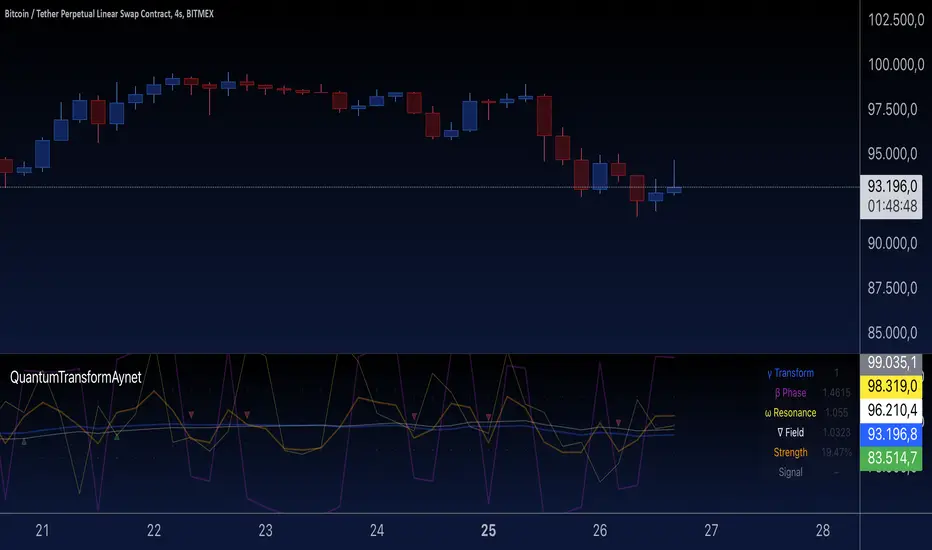
Quantum Transform - AynetQuantum Transform Trading Indicator: Explanation
This script is called a "Quantum Transform Trading Indicator" and aims to enhance market analysis by applying complex mathematical models. Written in Pine Script, the indicator includes the following elements:
1. General Structure
Quantum Parameters: Inspired by physical and mathematical concepts (Planck constant ℏ, wave function Ψ, time τ, etc.), it uses specific parameters.
Transformation Functions: Applies various mathematical operations to transform price data in different ways.
Signal Generation: Produces signals for long and short positions.
Visualization: Displays different price transformations and signals on the chart.
2. Core Parameters
The parameters allow users to control various transformations:
Planck Constant (ℏ): A scaling factor for wave modulation.
Wave (Ψ): Controls oscillation in price data.
Time (τ): The length of the lookback period for calculations.
Relativity (γ): Power factor in the Lorentz transformation.
Phase Shift (β): Manages phase shift in transformations.
Frequency (ω): Represents the frequency of price movements.
Dimensions (∇): Enables multi-dimensional field analysis.
3. Functions
a) Relativistic Transform
Inspired by the theory of relativity.
Calculates the Lorentz factor using the rate of price change.
Transforms price data to amplify the relativity effect.
b) Phase Transform
Calculates the phase of price data and applies wave modulation.
Creates phase and amplitude modulation based on the bar index.
c) Resonance Transform
Calculates resonance effects using natural frequency and oscillations.
Highlights periodic behaviors of price movements.
d) Field Transform
Applies multi-dimensional field calculations.
Combines strength, wave, and coherence aspects of price data.
e) Chaos Transform
Implements a chaos effect based on sensitivity analysis.
Simulates chaotic behaviors of price movements.
4. Main Calculations
Quantum Price: The average of all transformation functions.
Bands:
Upper Band: The highest level of quantum price.
Lower Band: The lowest level of quantum price.
Mid Band: The average of upper and lower bands.
Momentum: Calculates the rate of change in quantum price.
5. Signal Generation
Long Signal:
Triggered when the phase price crosses above the field price.
Momentum must be positive, and the price above the mid-band.
Short Signal:
Triggered when the phase price crosses below the field price.
Momentum must be negative, and the price below the mid-band.
Signal strength is calculated relative to the momentum moving average.
6. Visualization
Each transformation is displayed in a unique color.
Bands and Momentum: Visualize price behavior.
Signal Icons: Show buy/sell signals using up/down arrows on the chart.
7. Information Panel
A table in the top-right corner of the chart displays:
The current values of each transformation.
Signal strength (as a percentage).
The type of signal (⬆: Long, ⬇: Short).
Applications
Trend Following: Analyze trends with complex transformations.
Resonance and Chaos Analysis: Understand dynamic behaviors of price.
Signal Strategies: Create strong and reliable buy/sell signals.
If you have any additional questions or customization requests regarding this indicator, feel free to ask!
Azlan MA Silang PLUS++Overview
Azlan MA Silang PLUS++ is an advanced moving average crossover trading indicator designed for traders who want to jump back into the market when they missed their first opportunity to take a trade. It implements a sophisticated dual moving average system with customizable settings and re-entry signals, making it suitable for both trend following and swing trading strategies.
Key Features
• Dual Moving Average System with multiple MA types (EMA, SMA, WMA, LWMA)
• Customizable price sources for each moving average
• Smart re-entry system with configurable maximum re-entries
• Visual signals with background coloring and shape markers
• Comprehensive alert system for both initial and re-entry signals
• Flexible parameter customization through input options
Input Parameters
Moving Average Configuration
• MA1 Type: Choice between SMA, EMA, WMA, LWMA (default: EMA)
• MA2 Type: Choice between SMA, EMA, WMA, LWMA (default: EMA)
• MA1 Length: Minimum value 1 (default: 8)
• MA2 Length: Minimum value 1 (default: 15)
• MA1 & MA2 Shift: Offset values for moving averages
• Price Sources: Configurable for each MA (Open, High, Low, Close, HL/2, HLC/3, HLCC/4)
Re-entry System
• Enable/Disable re-entry signals
• Maximum re-entries allowed (default: 3)
Technical Implementation
Price Source Calculation
The script implements a flexible price source system through the price_source() function:
• Supports standard OHLC values
• Includes compound calculations (HL/2, HLC/3, HLCC/4)
• Defaults to close price if invalid source specified
Moving Average Types
Implements four MA calculations:
1. SMA (Simple Moving Average)
2. EMA (Exponential Moving Average)
3. WMA (Weighted Moving Average)
4. LWMA (Linear Weighted Moving Average)
Signal Generation Logic
Initial Signals
• Buy Signal: MA1 crosses above MA2 with price above both MAs
• Sell Signal: MA1 crosses below MA2 with price below both MAs
Re-entry Signals
Re-entry system activates when:
1. Price crosses under MA1 in buy mode (or over in sell mode)
2. Price returns to cross back over MA1 (or under for sells)
3. Position relative to MA2 confirms trend direction
4. Number of re-entries hasn't exceeded maximum allowed
Visual Components
• MA1: Blue line (width: 2)
• MA2: Red line (width: 2)
• Background Colors:
o Green (60% opacity): Bullish conditions
o Red (60% opacity): Bearish conditions
• Signal Markers:
o Initial Buy/Sell: Up/Down arrows with "BUY"/"SELL" labels
o Re-entry Buy/Sell: Up/Down arrows with "RE-BUY"/"RE-SELL" labels
Alert System
Generates alerts for:
• Initial buy/sell signals
• Re-entry opportunities
• Alerts include ticker and timeframe information
• Configured for once-per-bar-close frequency
Usage Tips
1. Moving Average Selection
o Shorter periods (MA1) capture faster moves
o Longer periods (MA2) identify overall trend
o EMA responds faster to price changes than SMA
2. Re-entry System
o Best used in strong trending markets
o Limit maximum re-entries based on market volatility
o Monitor price action around MA1 for potential re-entry points
3. Risk Management
o Use additional confirmation indicators
o Set appropriate stop-loss levels
o Consider market conditions when using re-entry signals
Code Structure
The script follows a modular design with distinct sections:
1. Input parameter definitions
2. Helper functions for price and MA calculations
3. Main signal generation logic
4. Visual elements and plotting
5. Alert system implementation
This organization makes the code maintainable and easy to modify for custom needs.

Asset Corr. with BTC/USD (Macroeconomics X BTC)This indicator provides a comprehensive analysis of the correlation between multiple assets (DXY, Gold, S&P 500, US10Y, and USDT Dominance) and their potential impact on the BTC/USD price. The script calculates the 24-hour percentage variation of these assets, determines their direction (bullish, bearish, or neutral), and displays this information in a table, helping traders assess how each asset is influencing BTC.
How the Script Works:
Asset Monitoring:
The script tracks the following assets:
DXY: The U.S. Dollar Index.
Gold (XAUUSD): The price of gold in U.S. dollars.
S&P 500 (SP500): A stock market index of U.S. companies.
US10Y: U.S. 10-year treasury yield.
USDT Dominance (USDT.D): The market dominance of USDT (Tether) in the crypto market.
Variation Calculation:
The script calculates the percentage variation for each asset over the last 24 hours using the close price of the previous day and the current close price on the 5-minute chart.
Based on the variation, the script determines the direction of each asset:
Bullish (1): Positive variation.
Bearish (-1): Negative variation.
Neutral (0): No significant change.
Impact Assessment:
The script uses weighted values for each asset to calculate its potential impact on BTC. The assets are given different weights:
DXY = 3
Gold = 2
S&P 500 = 2
US10Y = 3
USDT.D = 3
The direction and correlation of each asset are assessed to determine whether they are having a positive or negative impact on BTC. This impact is represented by arrows in the table.
Table Display:
The script displays a table on the chart, providing detailed information for each asset:
Asset: The name of the asset being analyzed.
Weight (Wgt): The assigned weight of the asset.
Direction (Dir): The current direction of the asset (up, down, or neutral).
24h Variation (Var %): The percentage change of the asset over the last 24 hours.
BTC Impact: The predicted impact of each asset on BTC, based on its direction and correlation.
Dominance Calculation:
A final "Dominance" score is calculated by summing the weighted values of each asset's direction and correlation with BTC.
This result is displayed in the table, providing a clear indication of whether the overall market sentiment is bullish or bearish for BTC.
How to Use the Script:
Add the Indicator: Apply the script to any chart with a 5-minute timeframe. The indicator works by analyzing the correlation of multiple assets with BTC, so it is best used for short-term traders looking to gauge BTC's price movement based on broader market trends.
Interpret the Table: The table shows the direction, variation, and impact of each asset on BTC. The "Dominance" row at the end of the table provides an overall sentiment score, helping traders understand whether the broader market is leaning bullish or bearish on BTC.
Monitor the Correlation: By tracking the assets with the highest weights and monitoring their influence on BTC, traders can make informed decisions on potential BTC price movements.
Key Concepts:
Asset Correlation: The script monitors multiple key assets that typically influence BTC's price, including the U.S. Dollar Index, Gold, S&P 500, US10Y, and USDT Dominance.
Impact Assessment: Uses weighted calculations to assess how each asset’s direction affects BTC.
Dominance Score: Provides a summary score of overall market sentiment, helping traders understand the broader influence on BTC.
Short-Term Trading: This tool is optimized for short-term traders who want to gauge market sentiment and its effect on BTC in real time.
For a better view of the table, right-click on >> visual order >> bring it to the top.

CBBS Suite [KFB Quant]CBBS Suite
The CBBS Suite is a specialized technical indicator that aggregates central bank balance sheet (CBBS) data from major global economies (US, EU, China, and Japan) and analyzes the data to assist with trend-following strategies. By using CBBS data as an economic signal, this tool provides insights into long and short trading opportunities based on macroeconomic changes.
Functionality :
The CBBS Suite aggregates central bank balance sheets, converting the combined data into percentage changes over multiple timeframes (30–360 days). It then calculates average scores to highlight the direction and strength of the CBBS trend, with customizable smoothing options for precision.
Signal Modes :
Users can select from three modes for optimal customization:
Standard – Displays unsmoothed trend signals.
Smoothed – Applies a smoothing function for clearer signal representation.
Combined – Shows both standard and smoothed signals for a comprehensive view
Indicator Features :
Thresholds : Customize long and short entry points based on score thresholds and percentage change limits.
Signal Smoothing : Choose from EMA, SMA, or WMA for trend smoothing, with adjustable lengths for greater flexibility.
Visuals : Background color coding for long and short zones and up/down triangles on chart bars to clearly identify long and short signals.
Limitations :
As with any indicator, CBBS Suite should be used as part of a broader trading strategy. It doesn’t predict future movements but instead reflects central bank activity trends.
This indicator is designed to add value to the TradingView community by providing unique macroeconomic insights based on central bank data trends. It’s a valuable tool for users looking to incorporate CBBS data into their technical analysis toolkit.
Disclaimer: This tool is provided for informational and educational purposes only and should not be considered as financial advice. Always conduct your own research and consult with a licensed financial advisor before making any investment decisions.

Predict Trend [Cometreon]Predict Trend is a forward-looking indicator that compares the current market trend with historical patterns, providing statistically based forecasts. Using advanced algorithms, it continuously scans for price behaviors similar to those in the past and projects average outcomes based on those patterns.
This innovative approach offers traders a powerful tool to anticipate market movements, refine strategies, and make data-driven decisions.
🔷 Key Features
🟩 Historical Pattern Analysis:
The indicator identifies and compares the current trend with similar historical patterns, providing predictions based on concrete and historical data.
🟩 Customizable Precision:
Offers the ability to adjust various parameters such as distance and percentage variation between levels, improving the accuracy of pattern search.
🟩 Historical Average-Based Predictions:
Displays the predicted movement based on the average of all historical patterns found, allowing for informed trading decisions.
🟩 Specific Pattern Search:
In addition to automatic search based on the active trend, Predict allows searching for specific patterns by manually entering the necessary data for analysis.
🟩 Forecast Visualization:
Provides a detailed table with all values found and a line representing the average of results, offering a clear view of predictions based on historical data.
🔷 Technical Details and Customizable Inputs
1️⃣ Precision Parameters - Allows adjusting the length of levels, pattern precision, and the number of subsequent values to obtain after identifying historical patterns.
2️⃣ Specific Pattern Search - Allows manual data entry to search for specific patterns, offering greater flexibility in analysis.
3️⃣ Timeframe - Predict works on any timeframe, with greater precision on higher timeframes.
4️⃣ Chart Compatibility - It is compatible with all chart types, allowing analysis and comparison of historical patterns regardless of the chart type used.
5️⃣ Level 1 - First correlation level for patterns. "Last Bar to Check" allows choosing the number of Pivots to check for searching patterns in the past with the same values (e.g., HH, LL, LH, and HL).
6️⃣ Level 2 - Checks the candle distance between each level. "Error Value Up-Down" allows adding a margin value between distances.
7️⃣ Level 3 - Verifies the percentage distance between levels. "Error Percent" allows adding an error margin to the percentage distance.
8️⃣ Bar to Have - Determines how many values after each pattern to display in the table.
9️⃣ Timezone - Enter the chart's time zone to display the precise start time of the pattern.
🔟 Manual Search - Allows searching for specific patterns by manually entering up to 8 values, including special values such as:
High Value : "HH" (Higher High) or "LH" (Lower High)
Low Value : "LL" (Lower Low) or "HL" (Higher Low)
Top / Bottom : "HH" or "LL"
Mid Level : "LH" or "HL"
1️⃣1️⃣ Approximate Trend - Shows a trend based on the average of values for each pattern in each section. Allows customizing up to 4 colors, line thickness, and style.
1️⃣2️⃣ Pattern Table - Shows the values of identified patterns. You can customize the number of patterns to show, display order, position, size, and table style.
1️⃣3️⃣ Displayed Elements - Customize elements shown on the table, such as Number, Date, or subsequent Swing values.
1️⃣4️⃣ Style Label - Modify the visual appearance of labels by selecting colors for background and text.
These options allow optimizing the indicator for different trading styles and market conditions, ensuring accurate and customized technical analysis.
🔍 How to Use Predict Trend
📌 Past Movement Analysis
Use the patterns found to compare past movements with the current trend, gaining a clear vision of possible future directions.
📊 Using Value Averages
Analyze the average of values from found patterns to get a more direct and synthetic view of past market behavior.
🎯 Specific Pattern Search
In addition to automatic search based on the active trend, Predict allows searching for specific patterns by entering the necessary data for targeted analysis.
☄️ With Predict Trend , you can simplify your market analysis, saving time and improving the accuracy of your decisions with predictions based on concrete and verifiable historical data.
Don't waste any more time and take advantage of the precision of historical pattern analysis to gain a competitive edge in the market.

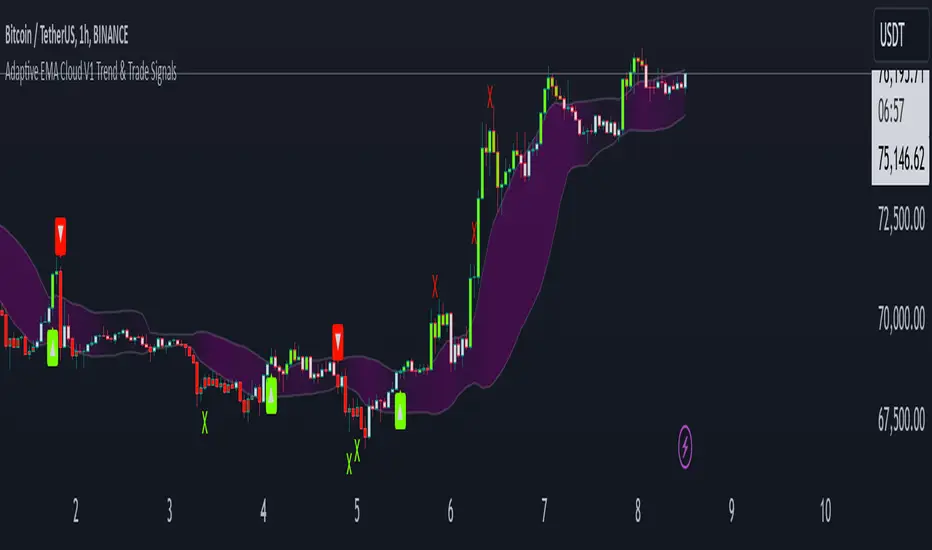
Adaptive ema Cloud v1 Trend & Trade Signals"adaptive ema cloud v1 trend & trade signals" is a comprehensive technical indicator aimed at assisting traders in identifying market trends, trade entry points, and potential take profit (tp) and stop-loss (sl) levels. this indicator combines adaptive exponential moving average (ema) clouds with standard deviation bands to create a visual trend and signal system, enabling users to better analyze price action.
key features:
adaptive ema cloud: calculates a dynamic ema-based cloud using a simple moving average (sma) line, with upper and lower deviation bands based on standard deviations. users can adjust the standard deviation multiplier to modify the cloud's width.
trend direction detection: the indicator determines trend direction by comparing the close price to the ema cloud and signals bullish or bearish trends when the price crosses key levels.
take profit (tp) and stop-loss (sl) points: adaptive tp and sl levels are calculated based on the deviation bands, providing users with suggested exit points when a trade is triggered.
peak and valley detection: detects peaks and valleys in price, aiding traders in spotting potential support and resistance areas.
gradient-based cloud fill: dynamically fills the cloud with a gradient color based on trend strength, helping users visually gauge trend intensity.
trade tracking: tracks recent trades and records them in an internal memory, allowing users to view the last 20 trade outcomes, including whether tp or sl was hit.
how to use:
trend signals: look for green arrows (bullish trend) or red arrows (bearish trend) to identify potential entries based on trend crossovers.
tp/sl management: tp and sl levels are automatically calculated and displayed, with alerts available to notify users when these levels are reached.
adjustable settings: customize period length, standard deviation multiplier, and color preferences to match trading preferences and chart style.
inputs-
period: defines the look-back period for ema calculations.
standard deviation multiplier: adjusts cloud thickness by setting the multiplier for tp and sl bands.
gauge size: scales the gradient intensity for trend cloud visualization.
up/down colors: allows users to set custom colors for bullish and bearish bars.
alert conditions: this script has built-in alerts for trend changes, tp, and sl levels, providing users with automated notifications of important trading signals.
Candlestick PatternsThis versatile candlestick patterns indicator combines traditional pattern recognition with trend detection and advanced alerting capabilities. It identifies key candlestick formations while validating them against market context through trend analysis.
### Features
🎯 Pattern Detection:
• Morning Star & Evening Star
• Hammer & Inverted Hammer
• Hanging Man
• Shooting Star
• Inside Bar
📈 Smart Trend Detection:
• Multiple methods available:
- EMA (14, 28)
- SMA (50, 200)
- ZigZag
- Combined methods
- No trend detection option
🎨 Visual Signals:
• Clear up/down arrows
• Pattern labels with tooltips
• Optional ZigZag visualization
• Color-coded inside bars
⚡ Advanced Alerts:
• JSON-formatted alerts with complete market data:
- OHLCV data
- Pattern information
- Market context
- Time and symbol details
• Standard TradingView alerts
• Custom alert messages
• Token-based authentication
### Settings
▶️ ZigZag Parameters:
• Depth: Controls sensitivity
• Deviation: Fine-tunes pattern detection
• Backstep: Adjusts repainting behavior
• Visual customization options
▶️ Pattern Detection:
• Morning/Evening Star thresholds
• Hammer pattern sensitivity
• Inside bar visualization
▶️ Trend Detection:
• Multiple methods to choose from
• Combinable indicators for better accuracy
▶️ Alert Configuration:
• Customizable JSON template
• Token authentication
• Complete market data output
### How to Use
1. Add indicator to your chart
2. Choose preferred trend detection method
3. Adjust pattern parameters if needed
4. Set up alerts with your JSON template
5. Monitor for validated patterns
### Trading Tips
• Wait for pattern confirmation with trend alignment
• Use support/resistance validation
• Combine with other technical indicators
• Consider volume analysis
• Use alerts for automated trading systems
### Disclaimer
This indicator is for educational and informational purposes only. Always perform your own analysis and validation before trading.
Good luck trading! 📈
#patterns #candlesticks #technical #alerts #trading #strategy

M & W Checklistindicator to Validate & Grade M & W Patterns.
Indicator Inputs
Table Color Palette
• Position Valid : Positions the Valid Trade table on the chart.
• Position Grade : Positions the Grade table on the chart, hover over the Column 1 Row 1 for a description of the bands.
• Size: Text size for all tables.
• Text Color : Sets text color.
• Border Color : Sets the table border color for all tables.
• Background Color : Sets table backgroud color for all tables.
Valid Trade Table
Checkboxes to indicate if the trade is valid. Fail is displayed if unchecked, Pass if checked.
Grade Table
• S/R Level 1: distance between neckline and 1st resistance area in % of the total distance between neckline and take profit. This is not for road blocks but pivot points etc before the initial run up/down in price. I have this set to 30% , this means that if there is a pivot point between the neckline and 30% of the TP level I weight it negatively.
• S/R Level 2: distance between neckline and 1st resistance area in % of the total distance between neckline and take profit. This is not for road blocks but pivot points etc before the initial run up/down in price. I have this set to 50% , this means that if there is a pivot point between the neckline and 50% of the TP level 2 weight it negatively but less so than level 1.
• S/R Level 3: distance between neckline and 1st resistance area in % of the total distance between neckline and take profit. This is not for road blocks but pivot points etc before the initial run up/down in price. I have this set to 70% , this means that if there is a pivot point between the neckline and 70% of the TP level 3 weight it negatively but less so than level 1 & level 2.
• Checkboxes are self explanatory, they are binary options, all are weighted negatively if checked and are weighted positively if unchecked. Divergence values for weighting are neutral if unckecked & weighted positively if checked.
• The select options are neutral weighting if set to neutral , if set to For its weighted positive and set to Against weighted negatively.
Technical Specification of the Scoring and Band System
Overview
The scoring system is designed to evaluate a set of technical trade conditions, assigning weights to various criteria that influence the quality of the trade. The system calculates a total score based on both positive and negative conditions. Based on the final score, the system assigns a grade or band (A, B, or C) for positive scores, and a "Negative" label for negative scores.
Scoring System
The system calculates the score by evaluating a set of 12 conditions (gradeCondition1 to gradeCondition12). These conditions are manually input by the user via checkboxes or dropdowns in a technical indicator (written in Pine Script for TradingView). The score weights vary according to the relative importance of each condition.
Condition Breakdown and Weighting:
1. Divergences (GradeCondition1 & GradeCondition2):
◦ 1H Divergence: +5 points if condition is true.
◦ 4H Divergence: +10 points if condition is true (stronger weight than 1H).
2. Support/Resistance at Neckline (GradeCondition3):
◦ Negative if present: -15 points if true (carries significant negative weight).
3. RB near Entry (GradeCondition4):
◦ Very Negative: -20 points if true (this is a critical negative condition).
4. RB can Manage (GradeCondition5):
◦ Slightly Negative: -5 points if true.
5. Institutional Value Zones (GradeCondition6 to GradeCondition8):
◦ For the trade: +5 points.
◦ Against the trade: -5 points.
◦ Neutral: 0 points.
6. S/R between Neckline & Targets (GradeCondition9 to GradeCondition11):
◦ Level 1: -10 points if true, +7 points if false.
◦ Level 2: -7 points if true, +7 points if false.
◦ Level 3: -5 points if true, +7 points if false.
◦ Use fib tool or Gann Box to measure any S/R levels setup according to your preferences.
7. News Timing (GradeCondition12):
◦ News within 3 hours: -20 points if true (strong negative factor).
◦ No upcoming news: +10 points if false.
Scoring Calculation Formula:
totalScore = score1 + score2 + score3 + score4 + score5 + score6 + score7 + score8 + score9 + score10 + score11 + score12
Where:
• score1 to score12 represent the points derived from the conditions described above.
Coloring and Visual Feedback:
• Positive Scores: Displayed in green.
• Negative Scores: Displayed in red.
Band System
The Band System classifies the total score into different grades, depending on the final value of totalScore. This classification provides an intuitive ranking for trades, helping users quickly assess trade quality.
Band Classification:
• Band A: If the totalScore is 41 or more.
◦ Represents a highly favorable trade setup.
• Band B: If the totalScore is between 21 and 40.
◦ Represents a favorable trade setup with good potential.
• Band C: If the totalScore is between 1 and 20.
◦ Represents a trade setup that is acceptable but may have risks.
• Negative: If the totalScore is 0 or less.
◦ Represents a poor trade setup with significant risks or unfavorable conditions.
Band Calculation Logic (in Pine Script):
var string grade = ""
if (totalScore >= 41)
grade := "Band A"
else if (totalScore >= 21)
grade := "Band B"
else if (totalScore >= 1)
grade := "Band C"
else
grade := "Negative"
Technical Key Points:
• Highly Negative Conditions:
◦ The system penalizes certain conditions more heavily, especially those that suggest significant risks (e.g., News in less than 3 hours, RB near Entry).
• Positive Trade Conditions:
◦ Divergences, Institutional Value Zones in favor of the trade, and lack of significant nearby resistance all contribute positively to the score.
• Flexible System:
◦ The system can be adapted or fine-tuned by adjusting the weights of individual conditions according to trading preferences.
Use Case Example:
• If a trade has 1H and 4H Divergence, RB near Entry (negative), and no upcoming news:
◦ 1H Divergence: +5 points.
◦ 4H Divergence: +10 points.
◦ RB near Entry: -20 points.
◦ No news: +10 points.
◦ Total Score: 5 + 10 - 20 + 10 = 5 → Band C.
This modular and flexible scoring system allows traders to systematically evaluate trades and quickly gauge the trade's potential based on technical indicators
Summary:
Maximum Score: 61
Minimum Score: -97
These are the bounds of the score range based on the current logic of the script.

Dynamic Sentiment RSI [UAlgo]The Dynamic Sentiment RSI is a technical analysis tool that combines the classic RSI (Relative Strength Index) concept with dynamic sentiment analysis, offering traders enhanced insights into market conditions. Unlike the traditional RSI, this indicator integrates volume weighting, sentiment factors, and smoothing features to provide a more nuanced view of momentum and potential market reversals. It is designed to assist traders in detecting overbought/oversold conditions, momentum shifts, and to generate potential buy or sell signals using crossover and crossunder techniques. By dynamically adjusting based on sentiment and volume factors, this RSI offers better adaptability to varying market conditions, making it suitable for different trading styles and timeframes.
This tool is particularly helpful for traders who wish to explore not only price movement but also the underlying market sentiment, offering a more comprehensive approach to momentum analysis. The sentiment factor amplifies the RSI's sensitivity to price shifts, making it easier to detect early signals of market reversals or the continuation of a trend.
🔶 Key Features
Dynamic Sentiment Calculation: The indicator incorporates a "Sentiment Factor" that adjusts the RSI length dynamically based on a multiplier, helping traders better understand market sentiment at different time intervals.
Volume Weighting: When enabled, the RSI calculations are weighted by volume, allowing traders to give more importance to price movements with higher trading volume, which may provide more accurate signals.
Smoothing Feature: A customizable smoothing period is applied to the RSI to help filter out noise and make the signal smoother. This feature is particularly useful for traders who prefer to focus on long-term trends while minimizing false signals.
Step Size Customization: A "Step Size" input allows users to round the sentiment RSI to predefined intervals, making the results easier to interpret and act upon. This feature allows you to focus on significant sentiment changes and ignore minor fluctuations.
Crossover/Crossunder Alerts: The indicator includes crossover and crossunder signals on the zero-line, helping traders identify potential buy and sell opportunities as the smoothed RSI crosses these levels.
The indicator offers a clear visual display with multiple color-coded lines and areas:
Sentiment RSI: Plotted as an area chart, color-coded based on sentiment strength.
Raw RSI: A purple line representing the raw adjusted RSI.
Smoothed RSI: A dynamic line, color-coded aqua or orange based on its position relative to the zero line.
Buy/Sell Signals: Triangle shapes are plotted at crossovers and crossunders, providing clear entry and exit points.
🔶 Interpreting the Indicator
Sentiment RSI
-This line represents the sentiment-adjusted RSI, where the higher the value, the stronger the bullish sentiment, and the lower the value, the stronger the bearish sentiment. It is rounded to step intervals, making it easier to detect significant shifts in sentiment.
- A positive sentiment RSI (above 0) suggests bullish market conditions, while a negative sentiment RSI (below 0) suggests bearish conditions.
Smoothed RSI
The smoothed RSI helps reduce noise and shows the trend more clearly.
Crossovers of the zero line are significant:
- Crossover above zero: Indicates that bullish momentum is building, potentially signaling a buying opportunity.
- Crossunder below zero: Signals a shift towards bearish momentum, potentially indicating a sell signal.
Traders should look for these crossovers in conjunction with other signals for more accurate entry/exit points.
Raw RSI (Adjusted)
The raw adjusted RSI offers a less smoothed, more responsive version of the RSI. While it may be noisier, it provides early signals of market reversals and trends.
Crossover/Crossunder Signals
- When the smoothed RSI crosses above the zero line, a "Signal Up" triangle appears, indicating a potential buying opportunity.
- When the smoothed RSI crosses below the zero line, a "Signal Down" triangle appears, signaling a potential sell opportunity.
These signals help traders time their entries and exits by identifying momentum shifts.
Volume Weighting (Optional)
- If volume weighting is enabled, the RSI will give more weight to periods of higher trading volume, making the signals more reliable when the market is highly active.
Strong Up/Down Levels (40/-40)
- These dotted lines represent extreme sentiment levels. When the sentiment RSI reaches 40 or -40, the market may be nearing an overbought or oversold condition, respectively. This could be a signal for traders to prepare for potential reversals or shifts in momentum.
By combining the various components of this indicator, traders can gain a comprehensive view of market sentiment and price action, helping them make more informed trading decisions. The combination of sentiment factors, volume weighting, and smoothing makes this indicator highly flexible and suitable for a variety of trading strategies.
🔶 Disclaimer
Use with Caution: This indicator is provided for educational and informational purposes only and should not be considered as financial advice. Users should exercise caution and perform their own analysis before making trading decisions based on the indicator's signals.
Not Financial Advice: The information provided by this indicator does not constitute financial advice, and the creator (UAlgo) shall not be held responsible for any trading losses incurred as a result of using this indicator.
Backtesting Recommended: Traders are encouraged to backtest the indicator thoroughly on historical data before using it in live trading to assess its performance and suitability for their trading strategies.
Risk Management: Trading involves inherent risks, and users should implement proper risk management strategies, including but not limited to stop-loss orders and position sizing, to mitigate potential losses.
No Guarantees: The accuracy and reliability of the indicator's signals cannot be guaranteed, as they are based on historical price data and past performance may not be indicative of future results.

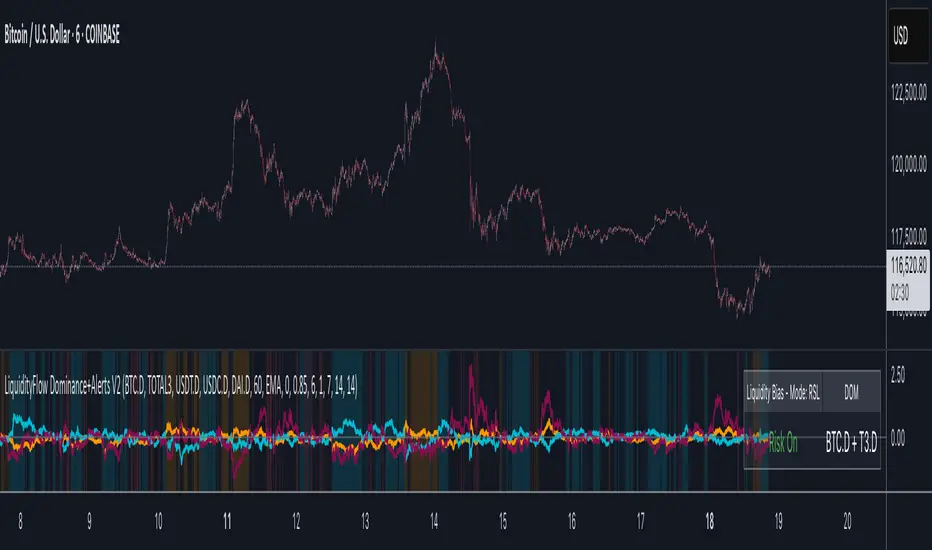
LiquidityFlow Dominance+Alerts (btc.d, T3, Stables)LiquidityFlow Dominance+Alerts: Overview & Usage Guide
Overview
The LiquidityFlow Dominance+Alerts indicator provides a dynamic view of liquidity flow across Bitcoin, Altcoins, and Stablecoins, helping track liquidity shifts and identify market sentiment. By integrating moving averages, custom alerts, and thresholds for extreme outliers, this indicator helps to anticipate bullish and bearish shifts in liquidity and alert market tops and bottoms.
Key features include:
1. Liquidity Flow Monitoring : Track liquidity flow across Bitcoin (BTC), Altcoins (TOTAL3), and Stablecoins (USDT, USDC, DAI).
2. Custom Alerts : Set alerts for key liquidity shifts and extreme conditions in Stablecoin dominance, both with static and moving average (MA)-based calculations.
3. Moving Averages : Use Simple, Exponential, or Weighted Moving Averages to smooth out market data for more reliable signals.
4. Outlier Detection : Identify potential tops and bottoms using thresholds for Stablecoin dominance, with alerts for extreme movements.
Functionality
Data Inputs and Key Metrics
- Symbols Monitored:
- Bitcoin Dominance (BTC.D)
- Altcoin Market Cap (TOTAL3)
- Stablecoins (USDT.D, USDC.D, DAI.D)
- Liquidity Flow Conditions:
- Track percentage changes in dominance across sectors to detect liquidity flow into Bitcoin, Altcoins, or Stablecoins.
- Custom Metrics:
- Liquidity Flow Index: BTC Dominance minus Stablecoin Dominance.
- Liquidity Flow Ratio: BTC Dominance divided by the combined dominance of Stablecoins and Altcoins.
Moving Average Integration
- Select from SMA, EMA, or WMA to apply moving averages to the dominance metrics. Moving averages help smooth out short-term volatility and provide more consistent signals.
- Moving averages are applied to each sector (BTC, Altcoins, and Stablecoins) and compared to their previous period values to determine shifts in liquidity.
Alerts and Thresholds
- % Change Lookback Period: Adjust the lookback period to align with the timeframe of your chart. Shorter timeframes may require a lower lookback period, while higher timeframes may benefit from longer periods.
- Stables Bull/Bear % for Alerts: Set a threshold for when Stablecoin dominance becomes a bullish or bearish signal relative to BTC and Altcoins. A higher threshold may be used in volatile markets to filter out noise.
- Extreme Outliers Detection: Use the **Stables Up/Down Extreme Threshold** to identify potential market tops or bottoms when Stablecoin dominance deviates significantly from historical trends. The **Extreme Lookback Period** controls the time window for detecting these anomalies.
How to Use the Indicator
Adjusting the % Change Lookback Period
- The `% Change Lookback Period` should be adjusted based on your chart’s timeframe. For example, a shorter period (e.g., 7) works well for intraday charts, while longer periods (e.g., 14) might be more suitable for daily or weekly charts.
Setting Thresholds for Alerts
- Stables Bull/Bear % for Alerts: Adjust this setting to define when Stablecoin dominance triggers bullish or bearish alerts. A value like 1% could be a good starting point for most market conditions but can be fine-tuned based on volatility.
- Extreme Lookback Period: Define the lookback period for detecting extreme moves in Stablecoin dominance. This will help identify major tops and bottoms in the market. For shorter-term trades, consider using a shorter extreme lookback (e.g., 7-10 periods).
Alerts for Liquidity Shifts
- The indicator supports alerts for key liquidity shifts, which are useful for staying ahead of market movements. Alerts can be set to notify you when liquidity moves into:
- Bitcoin: Indicating a potential bullish trend for Bitcoin.
- Altcoins: Signaling altcoins are bullish.
- Stablecoins: Suggesting a risk-off environment or market correction.
Extreme Alerts for Stables
- Extreme Up/Down Alerts: These are triggered when Stablecoin dominance crosses extreme thresholds. For example, if Stablecoin dominance rises more than 14% over a set period, it could signal a market top, while a significant drop could indicate a market bottom.
Moving Average Calculations
- In addition to static percentage changes, moving averages can be applied to smooth out dominance values. The type and length of the moving average can be customized:
- SMA (Simple Moving Average): Best for smoothing out volatility in a linear way.
- EMA (Exponential Moving Average): More responsive to recent data, making it useful in faster markets.
- WMA (Weighted Moving Average): Emphasizes more recent data, but less reactive than the EMA.
Additional Usage Tips:
- Background Colors: The indicator visually highlights the dominant liquidity flow:
- Orange: Liquidity is shifting toward Bitcoin.
- Aqua: Liquidity is flowing into Altcoins.
- Red: Liquidity is moving into Stablecoins.
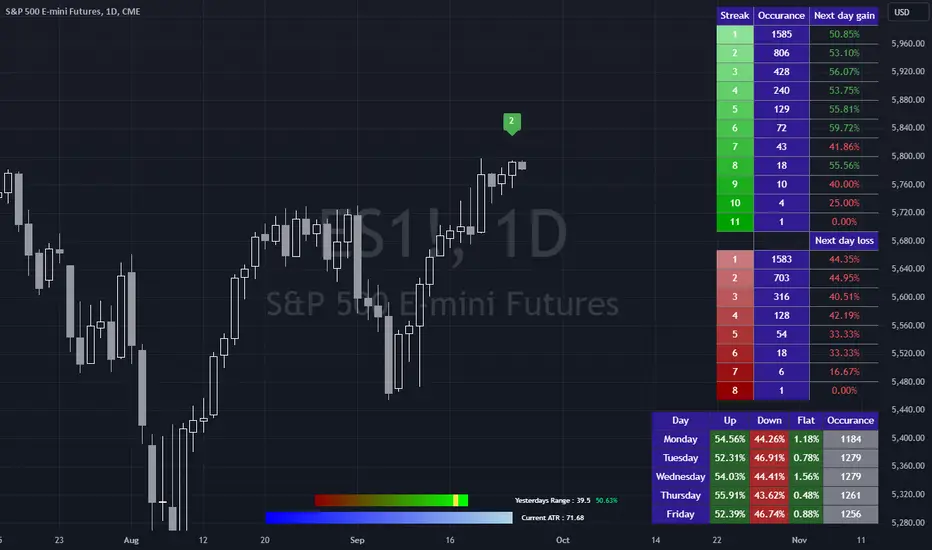
Bias FinderCan we look at what happened yesterday in the market to predict what happens today?
Not really, but we can use simple historical statistics to help form a bias for todays market direction.
This indicator attempts to do just that. It is broken into 3 parts, none of which are related to each other, but taken together can help a trader improve the quality of their daily bias.
The first table simply groups all the daily win and loss streaks together and looks at the change of the next day after each streak.
The second table groups each day of the week then returns what percentage of those days were up, down and flat.
The bottom graphic compares the range of the last session with the current ATR.
The code then groups each session into either being larger or smaller than the current ATR.
Once that is determined, the close is classified into which quartile of the range it closed in. This means there are 8 different groups of closes. Once a close has been grouped, it is compared with all the other closes of the same group to return the historical change of the next day. So for example, a day might have a range inside the current ATR and have closed in the 3rd quartile of the range. From this we can determine the historical percentage of days that were up days after such a close.
The only important thing here is to decide if you want to use a close to close change IE an up day is when the close is higher than the previous close, or an open to close where, as the name suggests, the close is higher than the open for an up day.
The start date and start month can be used to eliminate any bad data and it is advisable to check the start of your dataset to make sure any data included in the statistics is stable and legitimate.
Hope you find this useful!
Kaiser Window MAKaiser Window Moving Average Indicator
The Kaiser Window Moving Average is a technical indicator that implements the Kaiser window function in the context of a moving average. This indicator serves as an example of applying the Kaiser window and the modified Bessel function of the first kind in technical analysis, providing an open-source implementation of these functions in the TradingView Pine Script ecosystem.
Key Components
Kaiser Window Implementation
This indicator incorporates the Kaiser window, a parameterized window function with certain frequency response characteristics. By making this implementation available in Pine Script, it allows for exploration and experimentation with the Kaiser window in the context of financial time series analysis.
Modified Bessel Function of the First Kind
The indicator includes an implementation of the modified Bessel function of the first kind, which is integral to the Kaiser window calculation. This mathematical function is now accessible within TradingView, potentially useful for other custom indicators or studies.
Customizable Alpha Parameter
The indicator features an adjustable alpha parameter, which directly influences the shape of the Kaiser window. This parameter allows for experimentation with the indicator's behavior:
Lower alpha values: The indicator's behavior approaches that of a Simple Moving Average (SMA)
Moderate alpha values: The behavior becomes more similar to a Weighted Moving Average (WMA)
Higher alpha values: Increases the weight of more recent data points
In signal processing terms, the alpha parameter affects the trade-off between main-lobe width and side lobe level in the frequency domain.
Centered and Non-Centered Modes
The indicator offers two operational modes:
Non-Centered (Real-time) Mode: Uses half of the Kaiser window, starting from the peak. This mode operates similarly to traditional moving averages, suitable for real-time analysis.
Centered Mode: Utilizes the full Kaiser window, resulting in a phase-correct filter. This mode introduces a delay equal to half the window size, with the plot automatically offset to align with the correct time points.
Visualization Options
The indicator includes several visualization features to aid in analysis:
Gradient Coloring: Offers three gradient options:
• Three-color gradient: Includes a neutral color
• Two-color gradient: Traditional up/down color scheme
• Solid color: For a uniform appearance
Glow Effect: An optional visual enhancement for the moving average line.
Background Fill: An option to fill the area between the moving average and the price.
Use Cases
The Kaiser Window Moving Average can be applied similarly to other moving averages. Its primary value lies in providing an example implementation of the Kaiser window and modified Bessel function in TradingView. It serves as a starting point for traders and analysts interested in exploring these mathematical concepts in the context of technical analysis.
Conclusion
The Kaiser Window Moving Average indicator demonstrates the application of the Kaiser window function in a moving average calculation. By providing open-source implementations of the Kaiser window and the modified Bessel function of the first kind, this indicator contributes to the expansion of available mathematical tools in the TradingView Pine Script environment, potentially facilitating further experimentation and development in technical analysis.

Inverse Fisher Oscillator [BigBeluga]The Inverse Fisher Oscillator is a powerful tool for identifying market trends and potential reversal points by applying the Inverse Fisher Transform to normalized price data. This indicator plots multiple smoothed oscillators, each color-coded to signify their relation to dynamic volatility bands. Additionally, the Butterworth filter is incorporated to further refine trend signals. The Inverse Fisher Oscillator offers traders a visually appealing and insightful approach to trend analysis and market direction detection.
🔵 KEY FEATURES
● Inverse Fisher Oscillator Visualization
Multiple Oscillators : The indicator calculates and plots six different Inverse Fisher Oscillators, each smoothed at increasing levels to provide a layered view of price momentum.
Color-Coded Signals : The oscillator lines are color-coded based on their relation to the volatility bands—green for bullish momentum, red for bearish momentum, and yellow for neutral movements.
● Butterworth Filter Integration
Filtering : The Butterworth filter is applied to mid-line Bands to reduce noise, allowing for clearer trend detection.
// Calculate constants for the Butterworth filter
float piPrd = math.pi / mid_len
float g = math.sqrt(2)
float a1 = math.exp(-g * piPrd)
float b1 = 2 * a1 * math.cos(g * piPrd)
float coef2 = b1
float coef3 = -a1 * a1
float coef1 = (1 - b1 + a1 * a1) / 4
// Source data for the Butterworth filter
float source = ifish // The first inverse Fisher Oscillator is used as the source
// Previous source and butter filter values
var float butter = na // Initialize the 'butter' variable
// Handle null values using the nz function
float prevB1 = nz(butter , source) // Use 'source' as a fallback if butter is null
float prevB2 = nz(butter , source) // Use 'source' as a fallback if butter is null
// Calculate the Butterworth filter value
butter := coef1 * (source + (2 * source ) + source ) + (coef2 * prevB1) + (coef3 * prevB2)
● Numbered Signal Marks
Signal Markers : The indicator plots numbered signals on the chart when an oscillator crosses above the upper volatility band or below the lower volatility band.
Numbered Lines : Numbers correspond to the different oscillators (1-6), helping traders easily identify which smoothing level generated the signal.
Visual Cues : The signals are color-coded—green for bullish crossovers and red for bearish crossunders—providing clear visual cues for trend accumulation phases.
Mid-Line Option : Traders can choose between plotting the Butterworth filter as a dynamic mid-line or simply displaying it as part of the bands.
Volatility Bands : Dynamic volatility bands provide additional context for interpreting the strength and sustainability of trends.
● Dashboard Display
Real-Time Market Trend Overview : The dashboard in the bottom-right corner of the chart displays the market trend based on the Inverse Fisher Oscillator for six different smoothing levels, providing a clear visual summary of market direction.
Direction Symbols : Directional symbols (up, down, or neutral) are displayed in the dashboard, color-coded to represent bullish, bearish, or neutral momentum.
Current Price Display : The dashboard also shows the current price and highlights whether it is above or below the opening price.
🔵 HOW TO USE
● Identifying Trend Reversals
Bullish Reversals : When the oscillators short period lines start to cross above the upper volatility band (green), it indicates potential bullish momentum.
Bearish Reversals : When the oscillator crosses below the lower volatility band (red), it signals potential bearish momentum.
Neutral Signals : When the oscillator remains within the bands (yellow), it suggests that the market is in a neutral or consolidating state. Traders may choose to wait for a clearer trend signal.
● Using the Dashboard for Trend Overview
Market Trend Summary : The dashboard provides a quick overview of market direction across six different smoothing levels. Green arrows indicate bullish momentum, red arrows indicate bearish momentum, and wavy lines suggest neutrality.
Price Context : The dashboard also displays the current price, helping traders quickly assess whether the price is moving in the expected direction relative to their trend analysis.
● Volatility Band Interpretation
Volatility-Based Signals : Pay attention to how the oscillators interact with the volatility bands. Strong trends will often result in oscillators staying above or below the bands, while weaker trends or consolidations will see oscillators hovering within the bands.
🔵 CUSTOMIZATION
Length and Smoothing : Adjust the length and smoothing parameters to fit different market conditions and timeframes.
Bands Multiplier : Customize the multiplier for the volatility bands to make them more or less sensitive to price changes.
Mid-Line Type : Choose whether to display the Butterworth filter as a mid-line or incorporate it into the volatility bands.
Signal Markers : Toggle on or off the number markers for signal crossovers, making it easier to identify key entry and exit points.
🔵 CONCLUSION
The Inverse Fisher Oscillator combines the power of the Inverse Fisher Transform and the Butterworth filter to provide a sophisticated approach to trend and reversal detection. By leveraging volatility-based analysis and visually intuitive signals, this indicator helps traders spot potential entry and exit points with greater clarity. The customizable dashboard display adds further value, offering a real-time summary of market conditions to enhance decision-making. Use this tool in conjunction with other technical analysis methods to develop a well-rounded trading strategy.

Follow the Volumes / Path of Least ResistanceThis indicator tracks price movements following significant volume increases. It identifies volume spikes by comparing recent average volume to a longer-term average. After a spike, it monitors price changes over a specified number of bars.
In plain English, the point of this is to “let the market show it’s hand”, vs. other common and preemptive methods of execution.
You can think of it as a better version of a volume up/down indicator which only uses opening and closing prices to identify "bullish" or "bearish" behavior.
To optimize this, I used a very small range chart, hence the small values. You will need to experiment with other values, ESPECIALLY the % change. If you do not do this, the indicator will generate a lot of noise.
The indicator has three main conditions:
1. Significant price increase, bullish: A green triangle appears below the bar.
2. Significant price decrease, bearish: A red triangle appears above the bar.
3. Price change within thresholds: A fuschia triangle appears, pointing up or down based on the overall (short-term) trend. This is common behavior during trends. A spike in volume will appear, and price simply does not budge. Volume/price is essentially declaring a new found value, in which case prices tend to follow the impulse movement (see market profile theory).
The color scheme is intuitive: green for positive moves, red for negative, and fuschia for subtle changes following the existing trend. Blue circles mark volume spikes for reference, which I recommend using only for reference, and disabling to remove unneeded noise.
Because this indicator "lags" in the sense of waiting for the market to show its hand, best opportunities are typically found on retests of the volume spikes themselves. On drives, however, the market will unlikely pullback, which (in my view) is one of its best use cases.
Bottom line, you will need to adjust the parameters to the instrument. This is not a plug and play solution, but far more accurate than those which are.
Settings, and what they mean:
Volume spike average bars: length for identification of high volumes. On smaller timeframes, such as my optimization period, you’ll want several bars. But on something such as a 5 minute or higher, only 1.
Lookback period: for identification of high volumes.
Volume Increase Threshold (%): % which constitutes a jump in volume
Bars After Spike: How long to wait for ensuing price movement. Also sensitive to the timeframe you are using. 1-2 recommended for 5m+, more for smaller range-based.
Negative Price Change Threshold (%): For red arrows (Volume + Price Movement)
Positive Price Change Threshold (%): Inverse of above
WMA Period for Stability Function: When price spikes on high volumes but does not move (price is “trapped” between negative and positive price change thresholds) the indicator marks direction (in fuchsia) in the direction of the underlying trend. This short-term MA identifies that trend.
Finally, because this indicator is volume-based, I recommend using primary instruments only and discourage its use on CFDs or other firm-generated instruments. Just use the primary. I would ignore signals off the open, which is subject to erroneous behavior. Other methods are far more effective for that.
This script is purposely uncomplicated. Feel free to play with settings and change code to suit your needs.

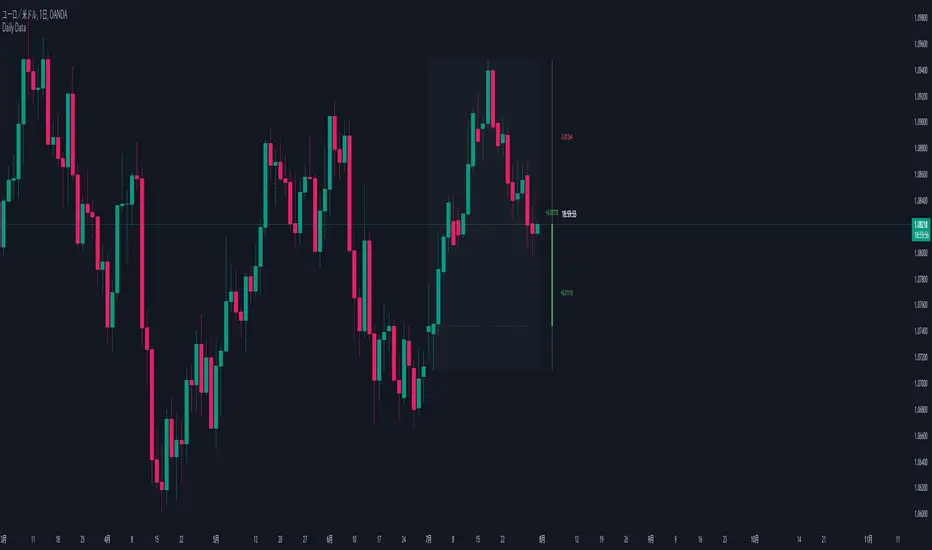
Daily Data1. Purpose:
This indicator visualizes higher timeframe data on lower timeframe charts, facilitating multi-timeframe analysis. It recreates and extends the functionality of the MQL indicator of the same name in PineScript.
2. Key Features:
a. Higher Timeframe Candle Display:
- Displays monthly data by default, but users can select any timeframe.
- Customizable candle colors (bullish/bearish), wick, and body sizes.
- Adjustable offset to change display position on the chart.
b. Price Range Box:
- Shows the high and low range of the higher timeframe as a semi-transparent box.
- Customizable background color.
c. Fibonacci Levels:
- Displays 7 Fibonacci levels within the higher timeframe price range (0, 23.6%, 38.2%, 50%, 61.8%, 78.6%, 100%).
- Uses different colors for each level and shows level values as labels.
- Can be toggled on/off.
d. Information Labels:
- Remaining Time Display: Countdown to the end of the current higher timeframe candle.
- Delta Display: Shows price change from the open of the current higher timeframe.
- Distance from High/Low: Displays the difference between current price and high/low.
- Each label can be customized for visibility and color.
3. Special Features:
- Displays "MARKET IS CLOSED" when the market is not open.
- Time display format includes months, days, hours, minutes, and seconds, abbreviated as needed.
- Delta and distance values change color based on positive/negative values and are displayed with up/down arrows.
4. Customizability:
- Extensive input options allow users to fine-tune appearance and functionality.
- Individual settings for colors, sizes, offsets, and display items.
Rolling Price Activity Heatmap [AlgoAlpha]📈 Rolling Price Activity Heatmap 🔥
Enhance your trading experience with the Rolling Price Activity Heatmap , designed by AlgoAlpha to provide a dynamic view of price activity over a rolling lookback period. This indicator overlays a heatmap on your chart, highlighting areas of significant price activity, allowing traders to spot key price levels at a glance.
🌟 Key Features
📊 Rolling Heatmap: Visualize historical price activity intensity over a user-defined lookback period.
🔄 Customizable Lookback: Adjust the heatmap lookback period to suit your trading style.
🌫️ Transparency Filter: Fine-tune the heatmap’s transparency to filter out less significant areas.
🎨 Color Customization: Choose colors for up, down, and highlight areas to fit your chart’s theme.
🔄 Inverse Heatmap Option: Flip the heatmap to highlight less active areas if needed.
🛠 Add the Indicator: Add the Indicator to favorites. Customize settings like lookback period, transparency filter, and colors to fit your trading style.
📊 Market Analysis: Watch for areas of high price activity indicated by the heatmap to identify potential support and resistance levels.
🔧 How it Works
This script calculates the highest and lowest prices within a specified lookback period and divides the price range into 15 segments. It counts the number of candles that fall within each segment to determine areas of high and low price activity. The script then plots the heatmap on the chart, using varying levels of transparency to indicate the strength of price activity in each segment, providing a clear visual representation of where significant trading occurs.
Stay ahead of the market with this powerful visualization tool and make informed trading decisions! 📈💼

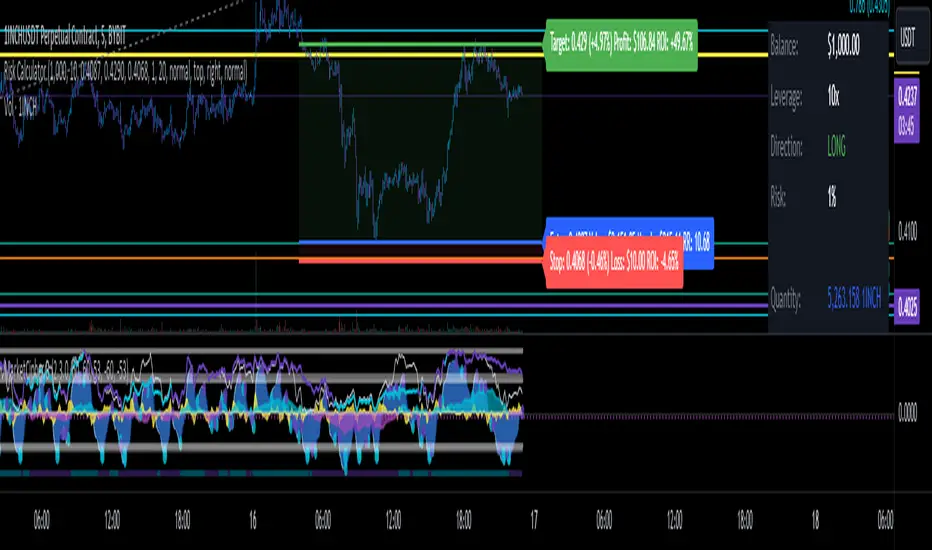
Risk CalculatorRisk Management Calculator
Created out of revenge against the difficulty of controlling psychology, greed, and risk management. Designed for cryptocurrency futures trading by following the risk management principles. Very welcome if there are suggestions and input to improve the quality of this "indicator". Please use wisely.
How to use:
1. Open indicator settings.
2. Fill out all the forms.
3. All of the information and calculation will appear on the label
4. You can adjust the three prices (target, entry, and stop) by clicking any part of the indicator. There will be three dots in the middle of the chart window (align with three prices). Click that dots and drag them up/down to customize according to your wishes. The price order must be correct, for LONG direction the price order from the top is target-entry-stop. Vice versa for SHORT direction. There will be "SETUP ERROR" text in the top-right box if the price order is not correct.
"Never, ever argue with your trading system." (by Michael Covel)
Pivot Points with MID LevelsThis indicator shows the Standard Pivot Points level based on daily values that can act as support and resistance. It is used by a variety of traders around the world. You can select which time frame Pivot Point Levels you'd like. Daily, weekly etc... Perfect for swing trading or day trading.
Pivot Points- Shows 3 levels of resistance, the Pivot Point and 3 levels of support
(R3, R2, R1, PIVOT POINT, S1, S2, S3
MID Levels- The MID levels are 50% retracement from the pivot point level above it and below
Example- R3, MID, R2, MID, R1, MID, PIVOT POINT, MID, S1, MID, S2, MID, S3
With this indicator you will also have the option to show the Previous days High and Low that are also important levels. On gap up/down days it is always interesting to see if price will close the gap, hence the important level to note.
PDH= Previous Days High
PDL= Previous Days Low
I have added a feature that you can now select specific color to each level and the line style for each level to help understand which levels are being show by personal needs.
Happy Trading

ALT Trend DetectionALT Trend Detection Indicator
Overview:
The "ALT Trend Detection" indicator is designed to help traders analyze the relationship between Bitcoin's dominance, Bitcoin's price, and the potential impact on altcoin prices. This indicator uses various time frames and average true range (ATR) calculations to detect trends and provide insights into the altcoin market conditions based on Bitcoin's movements.
How It Works:
BTC Dominance and Price Data:
The indicator fetches Bitcoin dominance data (percentage of the total cryptocurrency market cap that Bitcoin represents) and Bitcoin price data using the selected time frame.
It calculates whether Bitcoin dominance and price are trending up, down, or remaining stable based on ATR calculations.
Altcoin Trend Detection:
The indicator then evaluates different scenarios based on the combination of Bitcoin dominance and price movements. These scenarios help predict the potential impact on altcoin prices.
For instance, if Bitcoin dominance is up and Bitcoin price is up, it might indicate a bearish trend for altcoins. Conversely, if Bitcoin dominance is down and Bitcoin price is up, it might indicate a bullish trend for altcoins (altseason).
Table Display:
The indicator displays a table on the chart that summarizes the current conditions for Bitcoin dominance, Bitcoin price, and the expected impact on altcoins. Each cell in the table is color-coded to provide a quick visual representation of the trends.
Usage:
Add the indicator to your TradingView chart.
Customize the time frame, ATR multiplier, table position, table size, and background color as per your preference.
Observe the table displayed on the chart. It shows the current state of Bitcoin dominance, Bitcoin price, and the potential trend for altcoin prices based on predefined scenarios.
Use this information to make informed trading decisions about altcoins. For example, if the table shows "ALT SEASON" in green, it might be a good time to consider investing in altcoins.
By analyzing the interaction between Bitcoin dominance and price, this indicator helps traders identify potential opportunities and risks in the altcoin market.

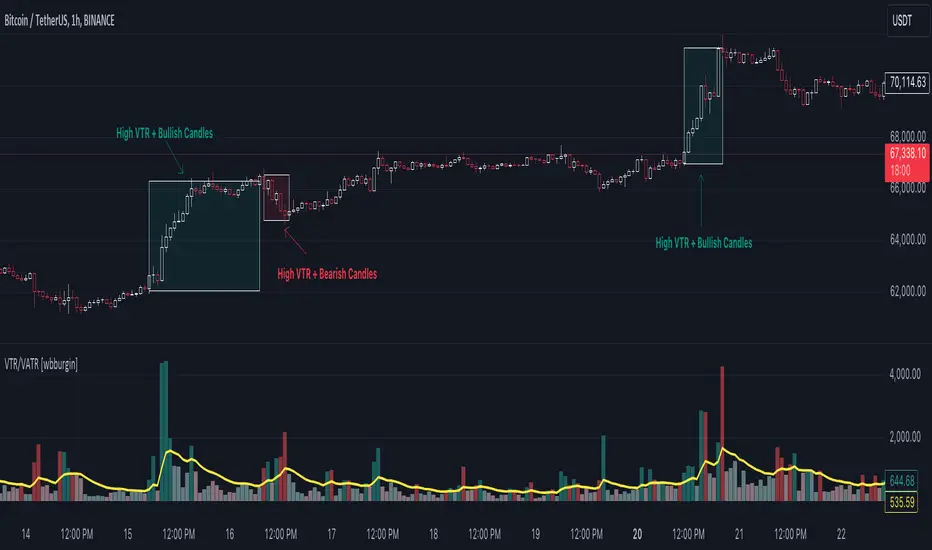
Volume True Range (VTR) and Volume Average True Range (VATR)This indicator uses lower-timeframe cumulative volume delta (CVD) candles to calculate the Volume True Range (VTR) of your instrument. The VTR is calculated similarly to the traditional true range, but uses volume instead (no price is involved in the calculation other than in the lower timeframe bar delta assignments). I haven't seen this concept developed before on TradingView or frankly the Internet, but I thought it seemed fairly intuitive; we can calculate the lower timeframe volume delta candles, so it makes sense to calculate a volume true range, which could show divergences in volume and price.
The VTR is calculated by the following code which uses the lower-timeframe CVD candles:
volumeTR = math.max(cvd_high - cvd_low, math.abs(cvd_high - nz(cvd_close )), math.abs(cvd_low - nz(cvd_close )))
The Volume Average True Range (VATR) is calculated by taking the RMA of the VTR, similarly to the ATR.
I would like to thank TradingView for the calculation of up/down intrabar volumes, which I referenced from their 'CVD - Cumulative Volume Delta Candles' indicator.
How to Use
The VTR and VATR can be used to identify price-volume trends and volatility divergences. A strong VTR (above the VATR of your specified length) can indicate the start or continuation of a trend, which you can identify via the VTR color (determined via price candle colors). Similarly, a rising VATR with most VTR bars of a specific color (green or red) will show that volume is moving in a specific price direction.
Additionally, the VATR plotted next to the ATR of the same length will show you volume volatility divergences. A strong VATR next to a muted/flat ATR indicates strong volume movement, which price might follow in the upcoming bars. Or, for trend reversals, a decreasing ATR after a strong trend combined with a rising VATR of the opposite trend may show a possible reversal.
Hope you all enjoy this.
-wbburgin
* Quick note: lower timeframe analysis returns only so much data. If you are on a high timeframe and the indicator is showing only a limited amount of bars, raise the lower timeframe (but still keep it below your current timeframe) so that the arrays can return more bars for you.
Average Directional Index ProThe Average Directional Index (ADX) is a moving average of a range, usually 14 days, that's used to quantify the strength and direction of a trend. ADX values are significant in that lower values indicate a weak to non-existent trend, i.e. ADX=14, whereas an ADX=40 is indicative of a strong trend. Additionally, a weak trend could signal that price has entered in to a consolidation phase. A trader could wait for price to rise or fall out of a supply zone while simultaneously looking for ADX values to climb up and over the 25 level, since the ADX could be strong enough for price to trend after the breakout. As a result, this type of setup could be an excellent entry for a trade. Keep in mind that price is the signal most important value on a chart so it's important to use an indicator like this to confirm a particular bias that you may have.
💥💥💥💥💥
Instead of using a single line as most ADX indicators do, I thought that showing the values in terms of histogram bars would be highly intuitive and provide an interesting visual that would illustrate with varying degrees of color where the strength (or lack thereof) lies at any given time. The following are some of the characteristics that I feel make this script stand out from the pack.
💡Histogram plots. ADX values range from 0-100 and it may seem counterintuitive to see an ADX value below a 0 line. With this approach, I've divided up the ADX values between "bull" and "bear", meaning if an ADX histogram bar is above the 0 line (no matter if the value is 5 or 50), it's because the DMI+ value is ABOVE the DMI- value. Conversely, if the ADX histogram bar is below the 0 line, it's because the DMI- value is ABOVE the DMI+ value. DMI and ADX go hand-in-hand and while DMI values do not play a prominent role here, you'll see their values in the Main Label.
💡Main label. The main label's color will correspond to that of the histogram bar. The DMI and ADX values are listed along with the current price of the asset. Whichever DMI value is higher will be listed ahead of the lower value. In other words, from left to right, you'll see the ADX value followed by the higher of the 2 DMI values followed by the lesser of the 2 DMI values. The ADX value will be followed by an icon showing you if the value is rising or falling. Additionally, the main label has some extras: both buy/sell % on the current chart as well as daily chart along with total volume and average volume for the respective time frames. You can also change the MA lengths for the chart and daily TF averages. Both buy/sell % and total/avg volume values come with their own significant values inputs.
💡Color coded histogram bars dependent on ADX values. A few examples: an ADX value between 30 and 40 when DI+ > DI-, you'll see a dark green bar. Conversely, if the ADX value is > 70 and DI- > DI+, you'll get a dark purple bar. All in all, there's 18 possible colors denoted within the histogram.
💡Momentum arrows. There's 4 colors for the up/down arrows that populate above the histogram bar when DI+ and DI- combined with ADX values are showing extreme values. An example would be when DI+ is between 30 and 50 and ADX is greater than 30, you'll get a green arrow. On the flipside, when DI- is greater than -50 and ADX is greater than 40, you'll see a dark red arrow.
💡ADX and price shown on the histogram. You can choose to have the price and ADX values side by side or on top of one another as well as change the decimal value with a "significant figure" input. You can also opt to have neither value shown. The values will show above or below their respective bar dependent upon if DMI+ or DMI- is the dominant value, which in turn determines if the histogram is above or below the 0 line.
💡Weak trend colors. Any ADX values between 0 to 23 will give varying degrees of black to light gray indicating a weak or no trend. An ADX value of 17 could indicate a weak trend but the value could be rising as buyers push price higher. As the ADX approaches 25, wait for price confirmation (and volume) to validate if momentum could continue.
💡Threshold lines. ADX values above +/- 25-30 tend to show a strengthening of trend and you can choose to include these lines or not in your charts.
💡ADX value follow line. Determined by DMI+ being > or < than DMI-. For instance, if the trend changes and DMI- crosses over DMI+, the follow line will switch to follow the ADX histogram bar as it falls below 0. You can choose to enable/disable this line.
💡Colored bars. You can choose to enable the ADX color schemes to your candles further providing an easy view of the current trend.
💥💥💥💥💥
Remember to use any indicator together with price action to confirm a particular bias you may have! You could also use this indicator in confluence with my Directional Movement Pro script for an extra visual on trend direction and strength.
💥💥💥💥💥
Should you have any questions, feedback etc, please do not hesitate to contact the script's author. My hope is that this indicator becomes an invaluable resource to you and you're able to integrate it in to your everyday trading tool bag to make more informed decisions.
SimpleCryptoLife helped me code up this script and he's been an incredible source of knowledge in my trading journey. Without his patience and pine script expertise, this script would not have been possible!
